_______________________________________
Market Watch
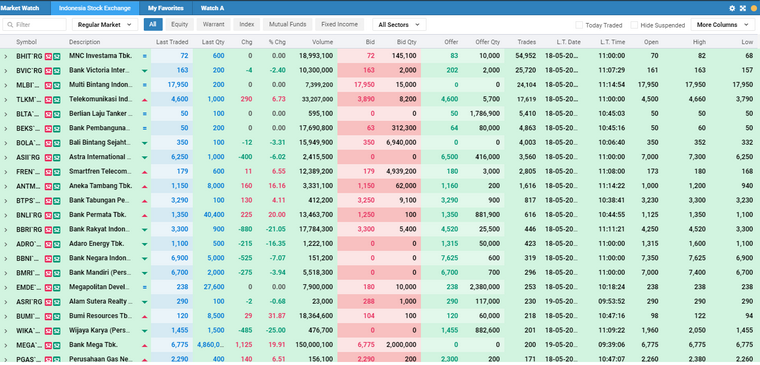
Use the Full Market to view real-time market information about the indices listed for the exchange, filtered by market/sub market segments and sectors.
This provides an overview of a particular stock’s performance for the current day. The Red arrow (up) or a Green arrow (down) indicates the current share price in relation to the price the stock was traded last. The bid and offer respectively tells you of the best buying and best selling price available for the stock at the time. Additionally, you are also provided with the Last Traded Price along with the Traded Quantity and Time.
The Change and % Change indicates the price difference between the current market price of the stock and the previous day’s closing price and its percentage change respectively. A gain in the price change is displayed in Red and the losing symbols are displayed in Green.
The Trades figure indicates how many trades have taken place for the stock whilst the Turnover shows the value of the shares traded. T.Volume is the total number of shares traded as at a given time.
•Today Traded – Tick this option to display only trades taken place today. •Hide Suspended – Tick this option to hide all suspended trades.
|