_______________________________________
Chart Modes
Use this procedure to choose the time period for which the chart information will be displayed. You can switch between Intraday or History modes at any given time. Intraday mode provides you the market movement ranging from a day to six days while History mode displays the market movement for a period longer than a week.
The pre-defined Intervals vary depending on the mode (i.e. History or Intraday modes). Once the interval is set, the chart is drawn based on the specified time
interval.
By default a chart is plotted in Intraday mode.
History mode Charting Intervals are as follows:
1.Daily 2.Weekly 3.Monthly 4.Quarterly 5.Yearly
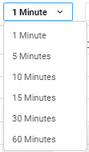
Intraday Charting Intervals are as follows:
1.Every minute 2.Every 5 minutes 3.Every 10 minutes 4.Every 15 minutes 5.Every 30 minutes 6.Every 60 minutes |
|
STEPS
To change Chart Modes:
1.On the Main Menu select  . . 2.Select and set the the preferred chart modes from the above lists.
|
|