Market Information
|
_______________________________________
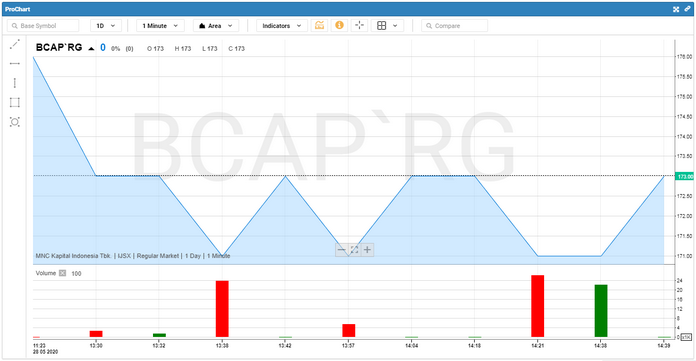
Advanced Chart
NetPlus comes with a powerful charting module, an ideal professional charting solution for Technical Analysis. The charting application is accompanied with advanced features such as Chart Comparison, Technical Indicators, Line studies, etc., and supports interactive zooming, dynamic data updates and history/intraday data analysis.
STEPS
To view the Chart:
1.On the Main Menu select  . . 2.Based on your requirement change the indicators, Chart Styles and Chart Interval. (Refer the Indicators section for more details.)
|
|